
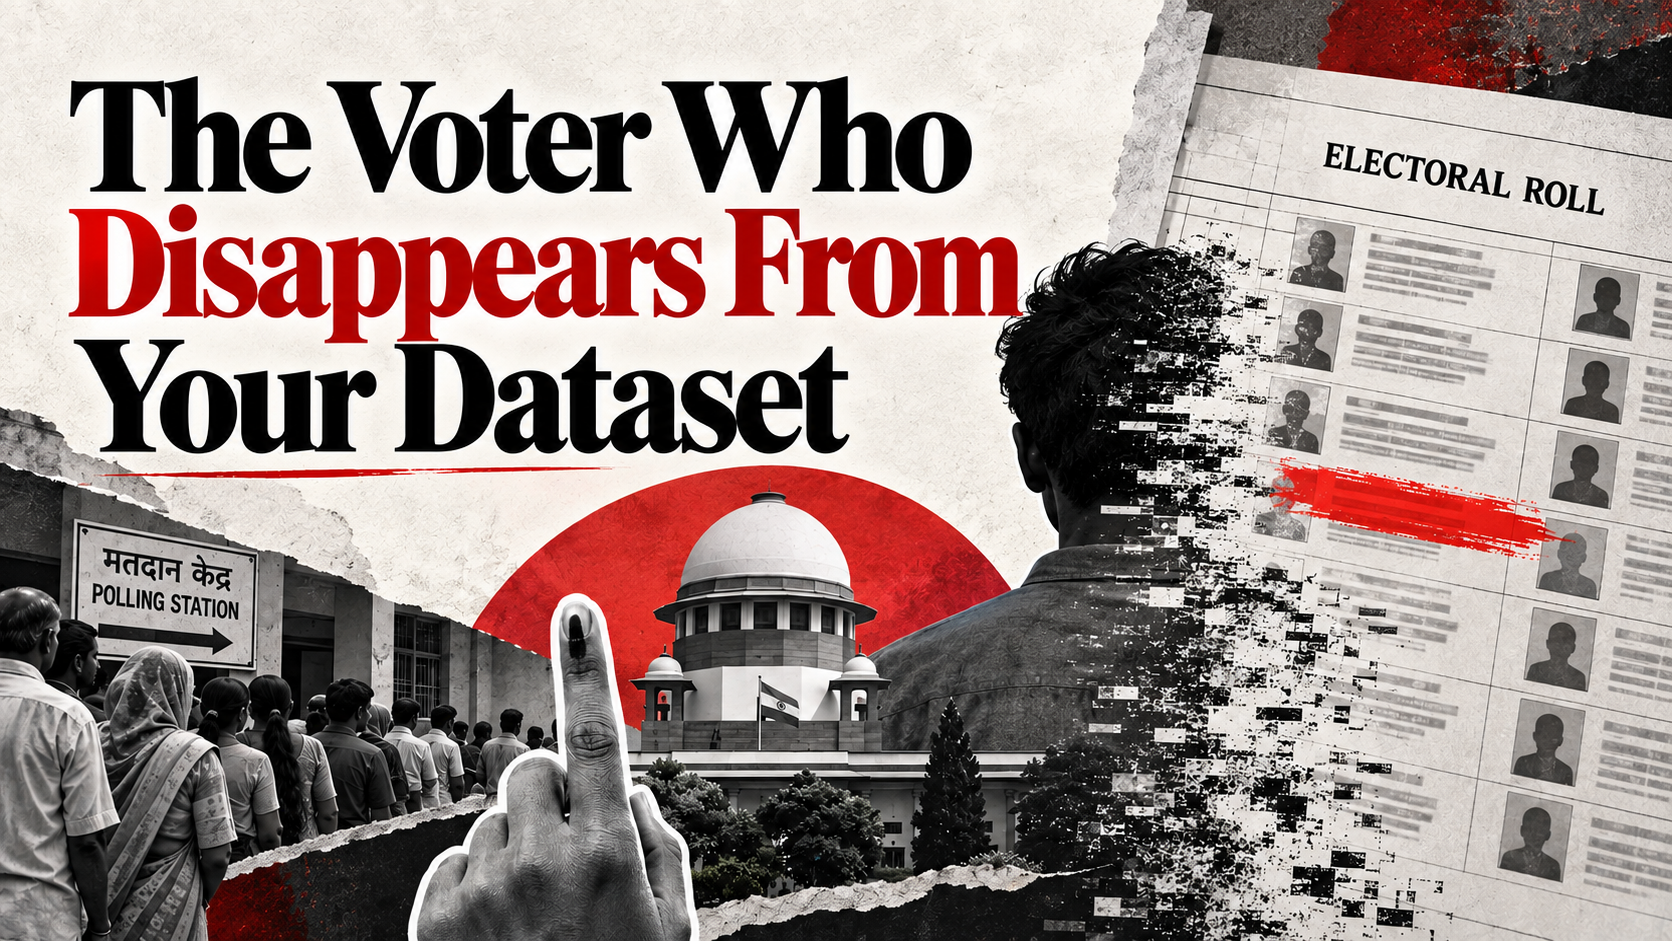
In political research, we spend a great deal of time studying the people who appear in the data.
Who voted?
Who did not?
Which booth had the highest turnout?
Which age group is growing?
Which constituency is becoming more urban?
Which issue is gaining attention?
Which community is overrepresented or underrepresented?
But there is another question that is often harder to ask:
Who is missing from the dataset?
That question becomes especially important when the dataset is an electoral roll.
Because an electoral roll is not simply a spreadsheet of voters.
It is the administrative foundation on which an election is organised.
And when a person’s name disappears from that dataset, the problem is not merely statistical.
It can become a question of whether that eligible citizen will be able to participate in the election.
The ongoing debate around India’s Special Intensive Revision, or SIR, offers a powerful case study in why political researchers need to think about missing data, electoral administration and ground reality together.
The Election Commission describes the integrity of electoral rolls as fundamental to free and fair elections, and its SIR framework is intended to identify and correct issues such as absent, shifted, deceased or duplicate entries while updating the rolls. Election Commission of India
But there is an important distinction between cleaning a dataset and understanding what disappears from it.
A voter can disappear without disappearing from society
Consider a simple example.
A voter has lived in a constituency for ten years.
They have an Aadhaar card.
They have a house.
They have a job.
They use government services.
Their neighbours know them.
But for whatever reason, their name does not appear in the relevant electoral roll after a revision.
From the perspective of everyday life, that person has not disappeared.
From the perspective of the electoral dataset, they have.
This is where data analysis can become dangerous if we forget what the data represents.
If a researcher downloads the latest electoral roll and calculates the size of the electorate, the missing voter is invisible.
If a political consultant builds a demographic profile from that roll, the voter is invisible.
If a campaign estimates turnout using that database, the voter is invisible.
If a constituency dashboard compares the new roll with an older one, the person appears as a reduction in the dataset rather than necessarily as a person whose electoral status needs investigation.
The database records an absence. It does not automatically explain the absence.
That distinction is fundamental.
The problem with treating every deletion as a number
One of the easiest mistakes in political research is to aggregate individual records too quickly.
10 voters missing from a booth becomes a number.
1,000 missing voters becomes a percentage.
1 lakh becomes a constituency-level statistic.
Millions become a national headline.
But aggregation can hide the story.
A reduction in an electoral roll can have many possible explanations.
Some people may have died.
Some may have permanently moved.
Some may have duplicate entries.
Some may have been incorrectly included earlier.
Some may have failed to complete a required process.
Some may have changed addresses.
And some eligible voters may have been wrongly excluded.
These categories cannot simply be placed into one bucket called “deleted voters.”
The analytical question is:
Why did each group disappear?
The Election Commission’s own SIR instructions recognise categories such as absent, shifted, death and duplicate when names are not included in draft rolls. Election Commission of India
That is precisely why political intelligence needs to go beyond the headline number.
The number tells us what changed.
The classification helps explain why it changed.
Field verification can help establish whether that explanation is correct.
The 13-crore question
This distinction became especially visible during the current SIR exercise.
About 13 crore names were not carried into draft electoral rolls across the exercise, according to reporting on the process. The Election Commission has subsequently directed officials to identify and facilitate the re-enrolment of eligible voters who may have been left out. The Indian Express
That number is enormous.
But even an enormous number needs context.
A draft roll is not necessarily a final determination that every person whose name is absent is permanently excluded from voting.
There are claims and objections.
There are opportunities for correction.
There are appeals.
There are procedures for re-enrolment.
The ECI has also stated that its safeguards include prior intimation, door-to-door verification, publication of draft rolls, claims and objections, and appeal mechanisms. Press Information Bureau
So the analytical mistake would be to jump from:
“13 crore names are missing from the draft”
to:
“13 crore eligible voters have been disenfranchised.”
Those are not automatically the same statement.
But the opposite mistake is equally serious:
“They are only numbers in a draft, so there is no problem.”
The right approach is to investigate what happened between the old dataset and the new one.
That is political intelligence.
Delhi shows why the details matter
The Delhi SIR debate provides an even more granular example.
More than 47 lakh names were reported as absent from the draft electoral rolls, while more than 33 lakh voters were issued notices on grounds including what authorities described as logical discrepancies or being unmapped. Petitioners before the Supreme Court sought greater disclosure about the names receiving notices and the reasons or criteria behind them. The Indian Express
This creates an important research question.
Not:
“How many names disappeared?”
But:
“What happened to the people behind those names?”
Were they deceased?
Had they moved?
Were they duplicates?
Were they incorrectly mapped?
Were they still living at the same address?
Did they receive notice?
Did they understand the notice?
Were they able to respond?
Was their name eventually restored?
And perhaps most importantly:
Can we identify where the system is most likely to miss an eligible voter?
That last question takes us from electoral statistics into political intelligence.
The voter who cannot respond is different from the voter who does not exist
This is perhaps the most important distinction in the entire discussion.
A data system can confuse absence of evidence with evidence of absence.
Someone may not respond to a notice because they never received it.
They may have moved temporarily.
They may be elderly.
They may not understand the procedure.
They may be working outside the constituency.
They may not have access to the necessary documentation.
They may simply not know that their electoral status has changed.
None of these circumstances necessarily means the person is ineligible.
This is why administrative datasets need to be understood alongside human behaviour.
The ECI’s voter-services platform currently provides tools for checking names, submitting documents against notices, filing applications, tracking status and contacting Booth Level Officers. Voter Services
Those mechanisms matter.
But a political researcher should still ask:
Who is least likely to use them?
That is where the invisible voter often lives.
Missing data is not evenly distributed
Another mistake is assuming that missing records are random.
They may not be.
People who are highly mobile can be harder to track.
People living in informal or rapidly changing settlements may face different administrative challenges.
Migrants may have complicated relationships with addresses.
Young voters may enter the electoral system for the first time.
Older voters may face difficulties with digital processes.
People who move between cities may appear differently across datasets.
And citizens who are less connected to administrative institutions may be less likely to notice that something has gone wrong.
This does not mean that every missing voter belongs to one particular social category.
It means researchers should test whether exclusions are geographically, administratively or demographically concentrated.
That is a much better question than simply asking for the total number.
This is where constituency analysis changes
Imagine two constituencies.
Constituency A loses 20,000 names.
Constituency B also loses 20,000.
At first glance, they look identical.
But suppose the reasons are different.
In Constituency A, most of the reduction comes from confirmed deaths, permanent migration and duplicate entries.
In Constituency B, a large share consists of unresolved cases, disputed entries or voters who have not been successfully contacted.
The same number has completely different analytical meaning.
Now take the analysis one level deeper.
What if the missing names are concentrated in particular booths?
What if those booths also have unusually high population mobility?
What if they have historically low registration rates?
What if claims and objections are unusually low there?
What if restoration rates are unusually high after verification?
Suddenly, the electoral roll itself becomes a source of administrative intelligence.
The question is no longer simply:
“How many voters are there?”
It becomes:
“How reliable is our picture of the electorate?”
Political intelligence needs a “missingness” layer
Most political dashboards focus on what is present.
I would argue that a serious political intelligence system should also have a missingness layer.
For every constituency, researchers should be able to ask:
How many names were added?
How many were removed?
How many were unchanged?
How many removals have confirmed reasons?
How many cases remain unresolved?
How many claims were filed?
How many objections were accepted?
How many names were restored?
Which booths show unusual changes?
Where are the largest discrepancies between administrative data and field observations?
And perhaps:
Where should researchers go physically to investigate further?
That final question is crucial.
Because the spreadsheet can tell you where something unusual happened.
It cannot always tell you why.
The field is where the dataset meets reality
This is why political research cannot be completely digital.
A dashboard might show a sharp decline in electors at a particular booth.
That should not immediately become a political conclusion.
It should become a field question.
Visit the area.
Speak to residents.
Check whether people have moved.
Speak to local officials.
Understand housing patterns.
Examine whether the booth boundary changed.
Look at previous rolls.
Compare claims and objections.
Check whether restored names changed the original pattern.
The purpose of fieldwork is not to confirm the dashboard.
It is to challenge it.
If the field tells you the dataset is wrong, the dataset needs another look.
If the field confirms the dataset, your confidence increases.
If the field produces a third explanation, your research becomes more interesting.
That is how political intelligence should work.
The most dangerous dataset is the one that looks complete
A missing record is visible only if someone asks where it went.
That is why clean-looking data can sometimes be more dangerous than messy data.
A messy dataset makes you cautious.
A perfectly formatted spreadsheet can make you overconfident.
Political researchers should therefore build habits around uncertainty.
Don’t just ask:
What does the data say?
Ask:
What does the data not capture?
Don’t just ask:
Who is included?
Ask:
Who might be missing?
Don’t just ask:
Why did the number fall?
Ask:
Which explanations have actually been verified?
Don’t just ask:
What changed between two electoral rolls?
Ask:
What happened to the people represented by those records?
The bigger lesson
The current SIR debate is fundamentally about electoral administration, but it also offers a broader lesson for anyone working with political data.
A voter list is not just a dataset.
Every row represents a person.
Every missing row represents a question.
And every unexplained change in the data deserves investigation before it becomes a political conclusion.
The Election Commission itself describes an inclusive and transparent electoral roll as foundational to free and fair elections, while current court proceedings and public debate have placed renewed attention on how exclusions, notices, verification and restoration are handled. Election Commission of India
The goal should not be to choose between “clean rolls” and “more voters.”
The goal should be an electoral roll that is both accurate and inclusive, with a process capable of identifying errors and correcting them.
For political researchers, the lesson is even broader.
Never mistake the dataset for reality.
Reality exists outside the spreadsheet.
Sometimes the most important voter in your analysis is the one the spreadsheet forgot to show you.
And that leaves us with a question worth asking before every constituency analysis:


Leave a Reply