
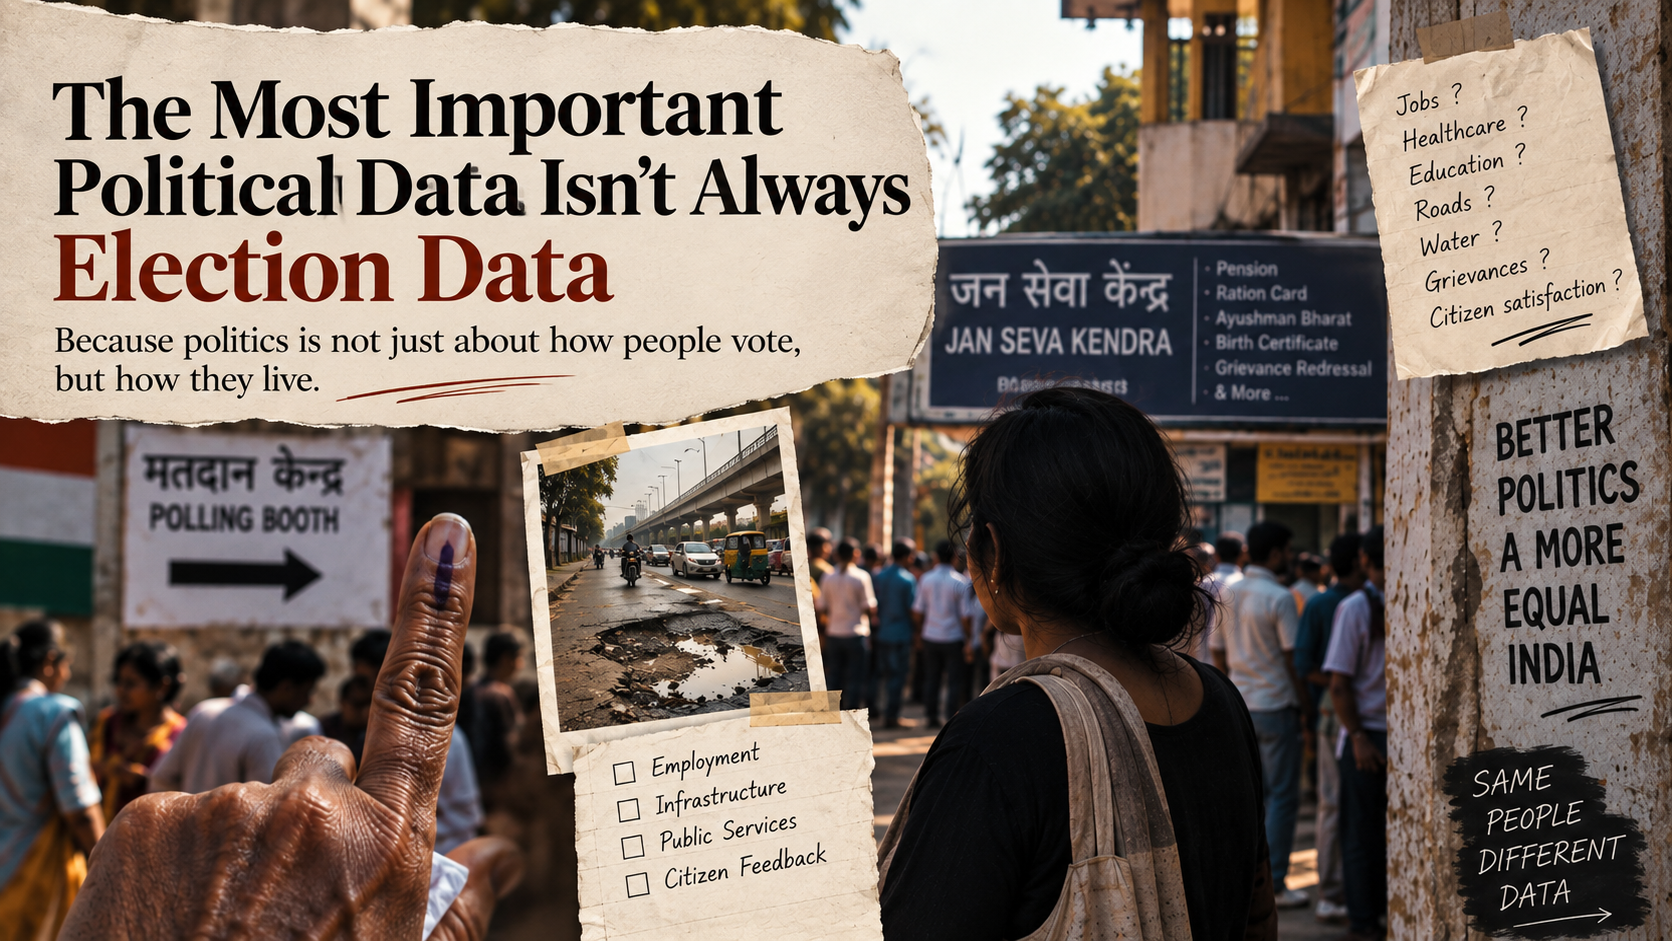
When we talk about political data, the conversation usually goes straight to elections.
Vote share.
Booth-level results.
Swing voters.
Turnout.
Demographics.
Opinion polls.
All of these matter.
But there is another category of political data that often tells us something even more important:
How people are actually experiencing government.
A voter may tell a survey researcher who they support. But their interaction with a government office, their unresolved grievance, their employment situation, or their experience with a public service can tell us something about why they feel that way.
For political strategy, that distinction matters.
Because elections measure political behaviour.
Governance data can help explain the environment in which that behaviour develops.
Look beyond the ballot box
Imagine a constituency where election data shows that a party has a strong support base.
That tells us something.
But now add a different set of information:
• The local employment situation
• Public grievances
• Road and water complaints
• Healthcare access
• School infrastructure
• Government-scheme utilisation
• Citizen satisfaction
• Local business conditions
• Housing and transport concerns
Suddenly, the constituency looks very different.
The election result tells you what happened.
The wider data can help you understand what people are living through.
That is why political organisations need to look beyond electoral databases.
Grievances are political data too
Consider India’s Centralised Public Grievance Redress and Monitoring System, or CPGRAMS.
Between 2023 and 2025, Central Government Ministries and Departments received 51.15 lakh public grievances, of which around 43.56 lakh, or 85%, were disposed of within the prescribed time limit. (Press Information Bureau)
That is a huge volume of citizen interaction with government.
And it represents something more than an administrative statistic.
Every grievance is, in some way, a signal.
A citizen who repeatedly complains about a service is telling the government that something is not working properly.
If thousands of citizens are complaining about the same issue, that pattern becomes even more significant.
The interesting question for a political strategist isn’t simply:
“How many complaints were received?”
It is:
“What are people repeatedly complaining about, and where?”
That can reveal issues that may not appear in an election survey.
Even “resolved” needs another layer of data
There is an important distinction between disposal and satisfaction.
Government data shows that grievance disposal has become faster. The average disposal time for Central Government Ministries and Departments was 15 days in 2025, compared with 28 days in 2019. (Press Information Bureau)
But when citizens were asked about the resolution itself, the picture was more nuanced.
Between January 2025 and February 2026, approximately 6 lakh resolved grievances received feedback, and 69.8% were rated satisfactory by complainants. (Press Information Bureau)
That difference is important.
A government can become faster at closing cases.
But political and administrative strategy should also ask whether citizens believe their problems were actually solved.
Speed is data. Satisfaction is data too.
Employment data tells another political story
Election data can tell us how young voters behaved.
Employment data can help us understand what young voters are dealing with.
The distinction is crucial.
A young person looking for work is not simply a demographic category in a political database.
They are experiencing a particular economic reality.
A political campaign that understands youth only through age brackets and social-media engagement is missing a large part of the picture.
The better questions are:
Are young people employed?
What kind of jobs do they have?
Are those jobs formal or informal?
Are wages increasing?
Are qualifications translating into employment?
Are young people leaving their hometowns for work?
These are not traditionally described as “election data.”
But they can be extremely relevant to political strategy.
Local data can be more useful than national averages
One of the biggest mistakes in political analysis is assuming that national trends automatically describe every constituency.
They don’t.
A national unemployment figure cannot tell you what employment looks like in one assembly constituency.
A national infrastructure statistic cannot tell you whether a particular neighbourhood has reliable water supply.
A national healthcare number cannot tell you whether patients in one district are travelling 50 kilometres to see a specialist.
Politics is local.
Data needs to be local too.
The real strategic opportunity lies in combining national data with state, district, constituency and even neighbourhood-level information.
That is where patterns begin to emerge.
Citizen feedback can become an early-warning system
Consider a simple example.
Suppose complaints about a particular government service suddenly increase in one district.
Election data may not show anything unusual yet.
But grievance data could be signalling a problem.
If the increase continues, social-media conversations begin reflecting the same issue, local journalists start reporting it and field researchers hear similar complaints, the pattern becomes much harder to dismiss.
This is where political data becomes more than election forecasting.
It becomes an early-warning system.
The same principle works in the opposite direction.
If a government programme is receiving strong citizen feedback in one area, understanding why it is working could help policymakers and political organisations identify practices that can be replicated elsewhere.
The best political data connects different dots
Imagine putting five datasets on the same map:
Election results + grievances + employment + public services + citizen feedback
Each dataset tells a different story.
Together, they can reveal something much richer.
Perhaps an area has strong government-scheme utilisation but weak citizen satisfaction.
Perhaps another area has relatively good service delivery but little political communication around it.
Perhaps a constituency with strong electoral support is experiencing growing employment concerns.
Perhaps a seemingly quiet area has a rapidly increasing number of complaints.
None of these patterns automatically tells us how people will vote.
And that is precisely why they are valuable.
They help explain the context behind political behaviour, rather than pretending that data can perfectly predict it.
This changes the role of a political consultant
A political consultant cannot afford to look only at the election calendar.
The work begins much earlier.
Before asking:
“Who will vote for us?”
there are more fundamental questions:
What are people worried about?
What services are they struggling with?
What do they think government is doing well?
Where do they feel ignored?
Which issues are growing quietly?
What problems are visible on the ground but missing from the campaign’s internal reports?
These questions require more than opinion polls.
They require a combination of administrative data, field research, citizen feedback, economic indicators, constituency research and electoral information.
Data should inform strategy, not replace judgement
There is also a danger in the opposite direction.
Having more data does not automatically create better political strategy.
A spreadsheet cannot understand a constituency by itself.
Numbers need context.
A rise in complaints may indicate worsening service delivery.
Or it may indicate that citizens have simply become more aware of the grievance system.
A low number of complaints may mean there is little dissatisfaction.
Or it may mean people don’t know where to complain.
Data needs interpretation.
That is why ground research remains important.
The strongest political analysis combines what the numbers say with what people say.
The political database of the future will look different
The traditional political database asks:
Who voted?
The modern one needs to ask much more:
What do people need?
What are they experiencing?
What are they complaining about?
What is changing in their local economy?
Which public services are working?
Which aren’t?
And how are these experiences shaping political attitudes?
This doesn’t mean election data has become less important.
It means election data is only one piece of a much larger puzzle.
The ballot box tells us the final result.
But if we want to understand politics properly, we need to study everything that happens before the ballot reaches the box.
Because sometimes the most important political signal isn’t hidden in a vote share.
It is hidden in a grievance.
A job.
A hospital visit.
A delayed government service.
A broken road.
A citizen complaint.
Or a conversation happening quietly in a neighbourhood that nobody in the campaign office has heard yet.
The best political strategy doesn’t just study how people vote.
It studies how people live. 🇮🇳
Leave a Reply